Note: this article can also be viewed as a guest blog post on the Transitland website. A huge thank you to them for helping sharing our work with the wider public transit developer community!
All computer science majors at Stanford are required to carry out a senior capstone project, so during my final quarter as an undergrad I collaborated with two friends to build Transitcat, a web application aimed at helping public transit planners visualize and better understand their networks. In order to narrow down what we wanted to work on, we conducted needfinding interviews with folks from many professions, including public transit planners, urban studies lecturers, and software developers who work on other public transit-oriented products. Based on these interviews, we were able to identify gaps in the market and decided to build a tool that:
- is user-friendly and designed for public transit planners with minimal technical experience,
- provides vulnerability analysis,
- generates isochrone maps,
- correlates public transit data with nearby business information, and
- is free!
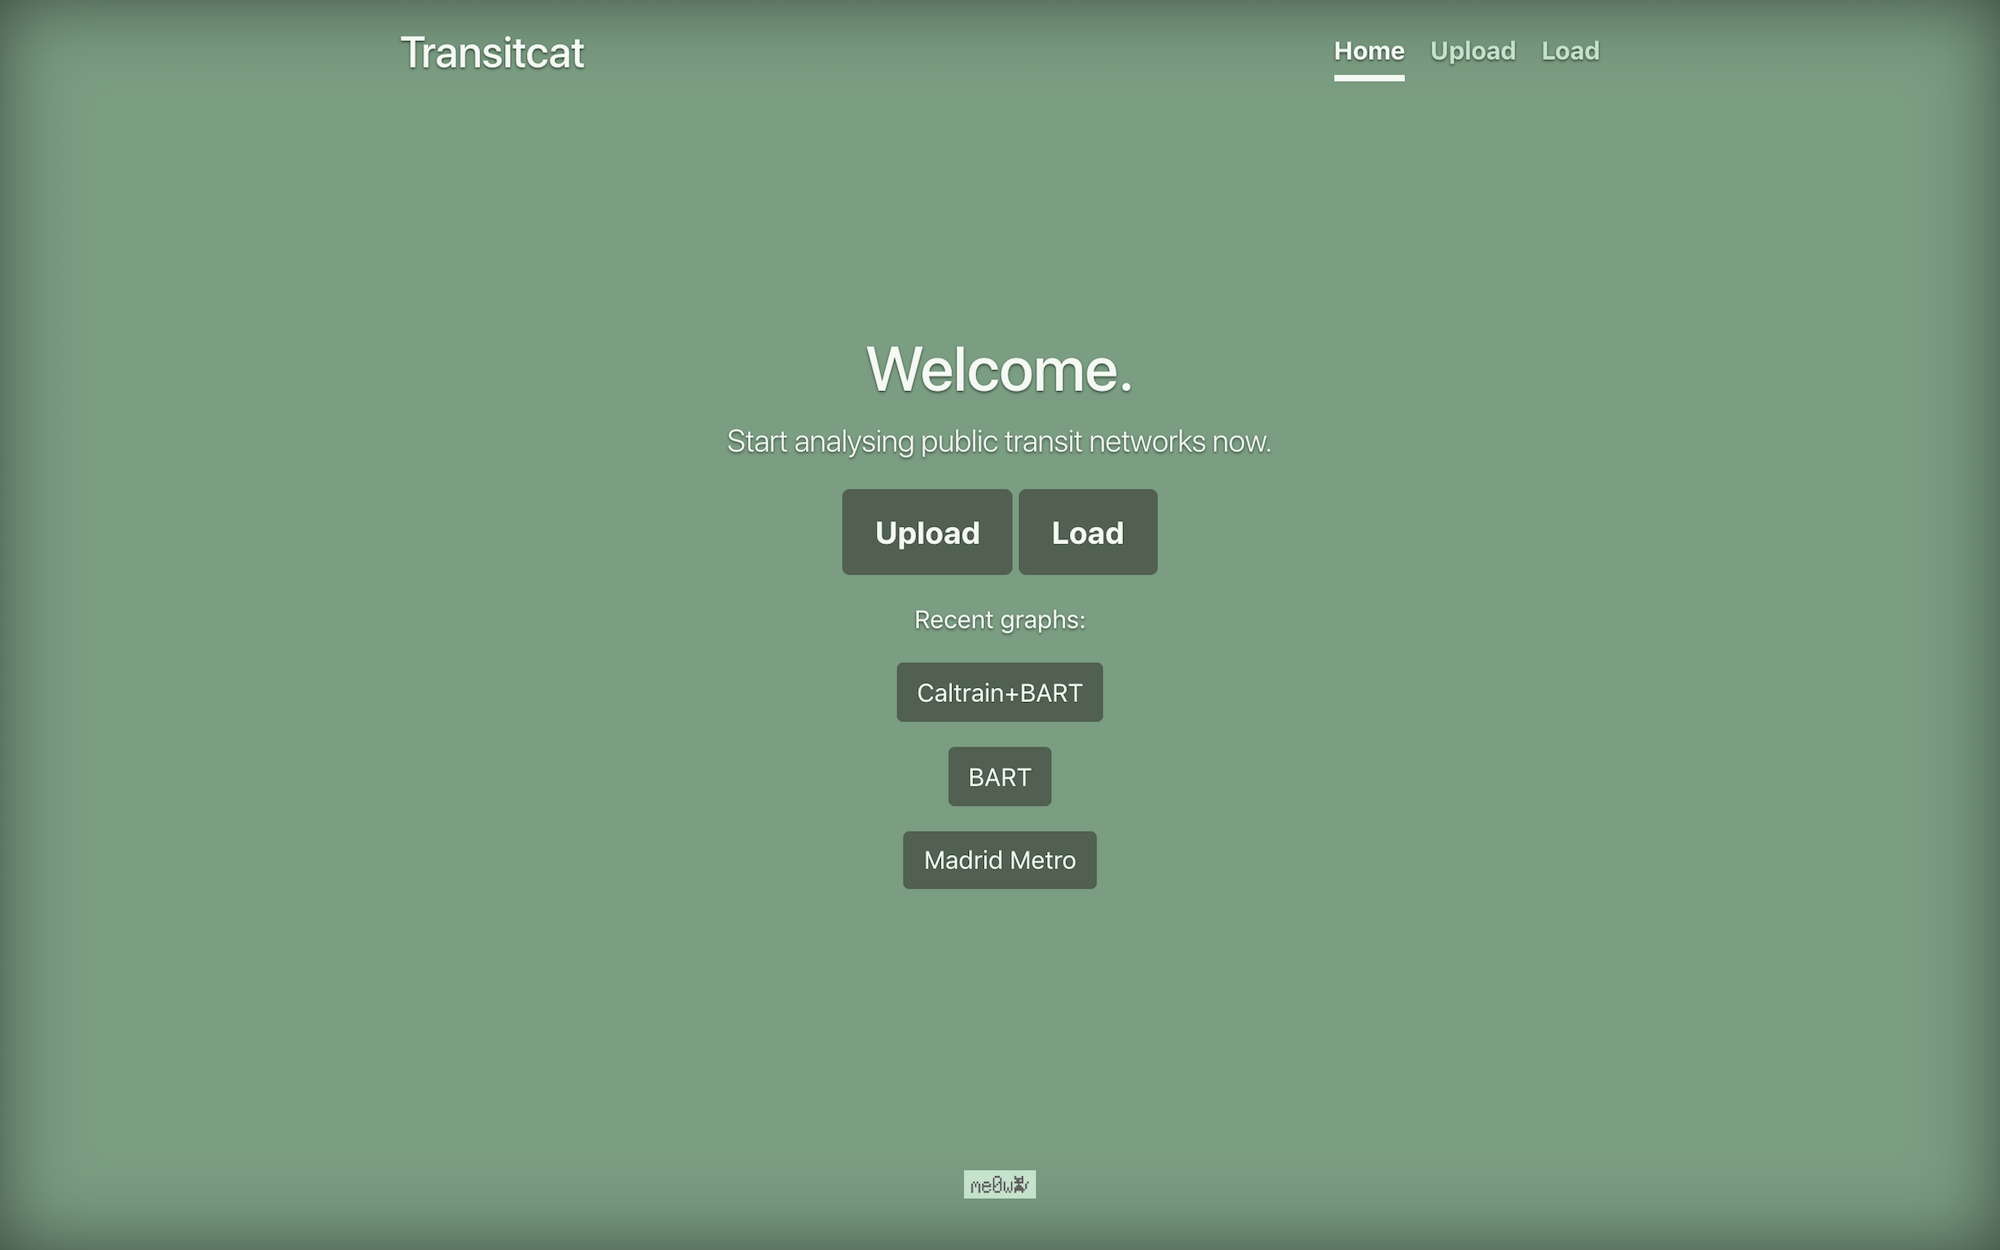
At the core of Transitcat is GTFS, which is a common format for public transportation schedules and associated geographic information. Specifically, GTFS is a series of text files (often zipped together) that a public transit agency publishes online for developers (like us!) to use to build cool applications. Transitland (which partially inspired the name of our project) has an up-to-date Feed Registry for discovering available GTFS feeds. It also provides an excellent API for querying GTFS information in a precise yet efficient manner; Transitcat relies extensively on this service in order to make vulnerability and isochrone calculations. More on this later!
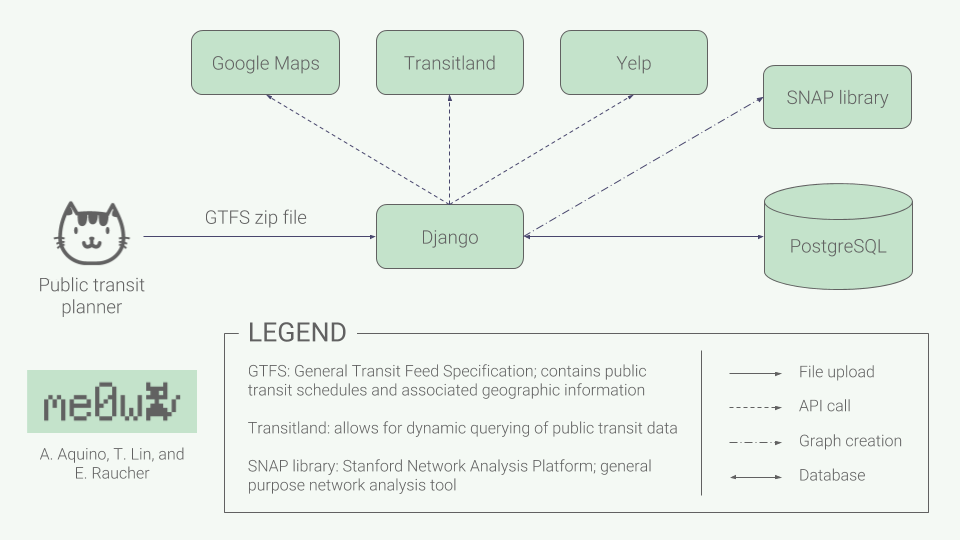
As noted in the architecture diagram below, in addition to Transitland, Transitcat relies on a few other technologies, including:
- Google Maps, for visualizing stops, routes, and isochrones;
- Yelp, for querying nearby business information; and
- SNAP, a powerful graph library for modeling public transit networks as computer science graphs.
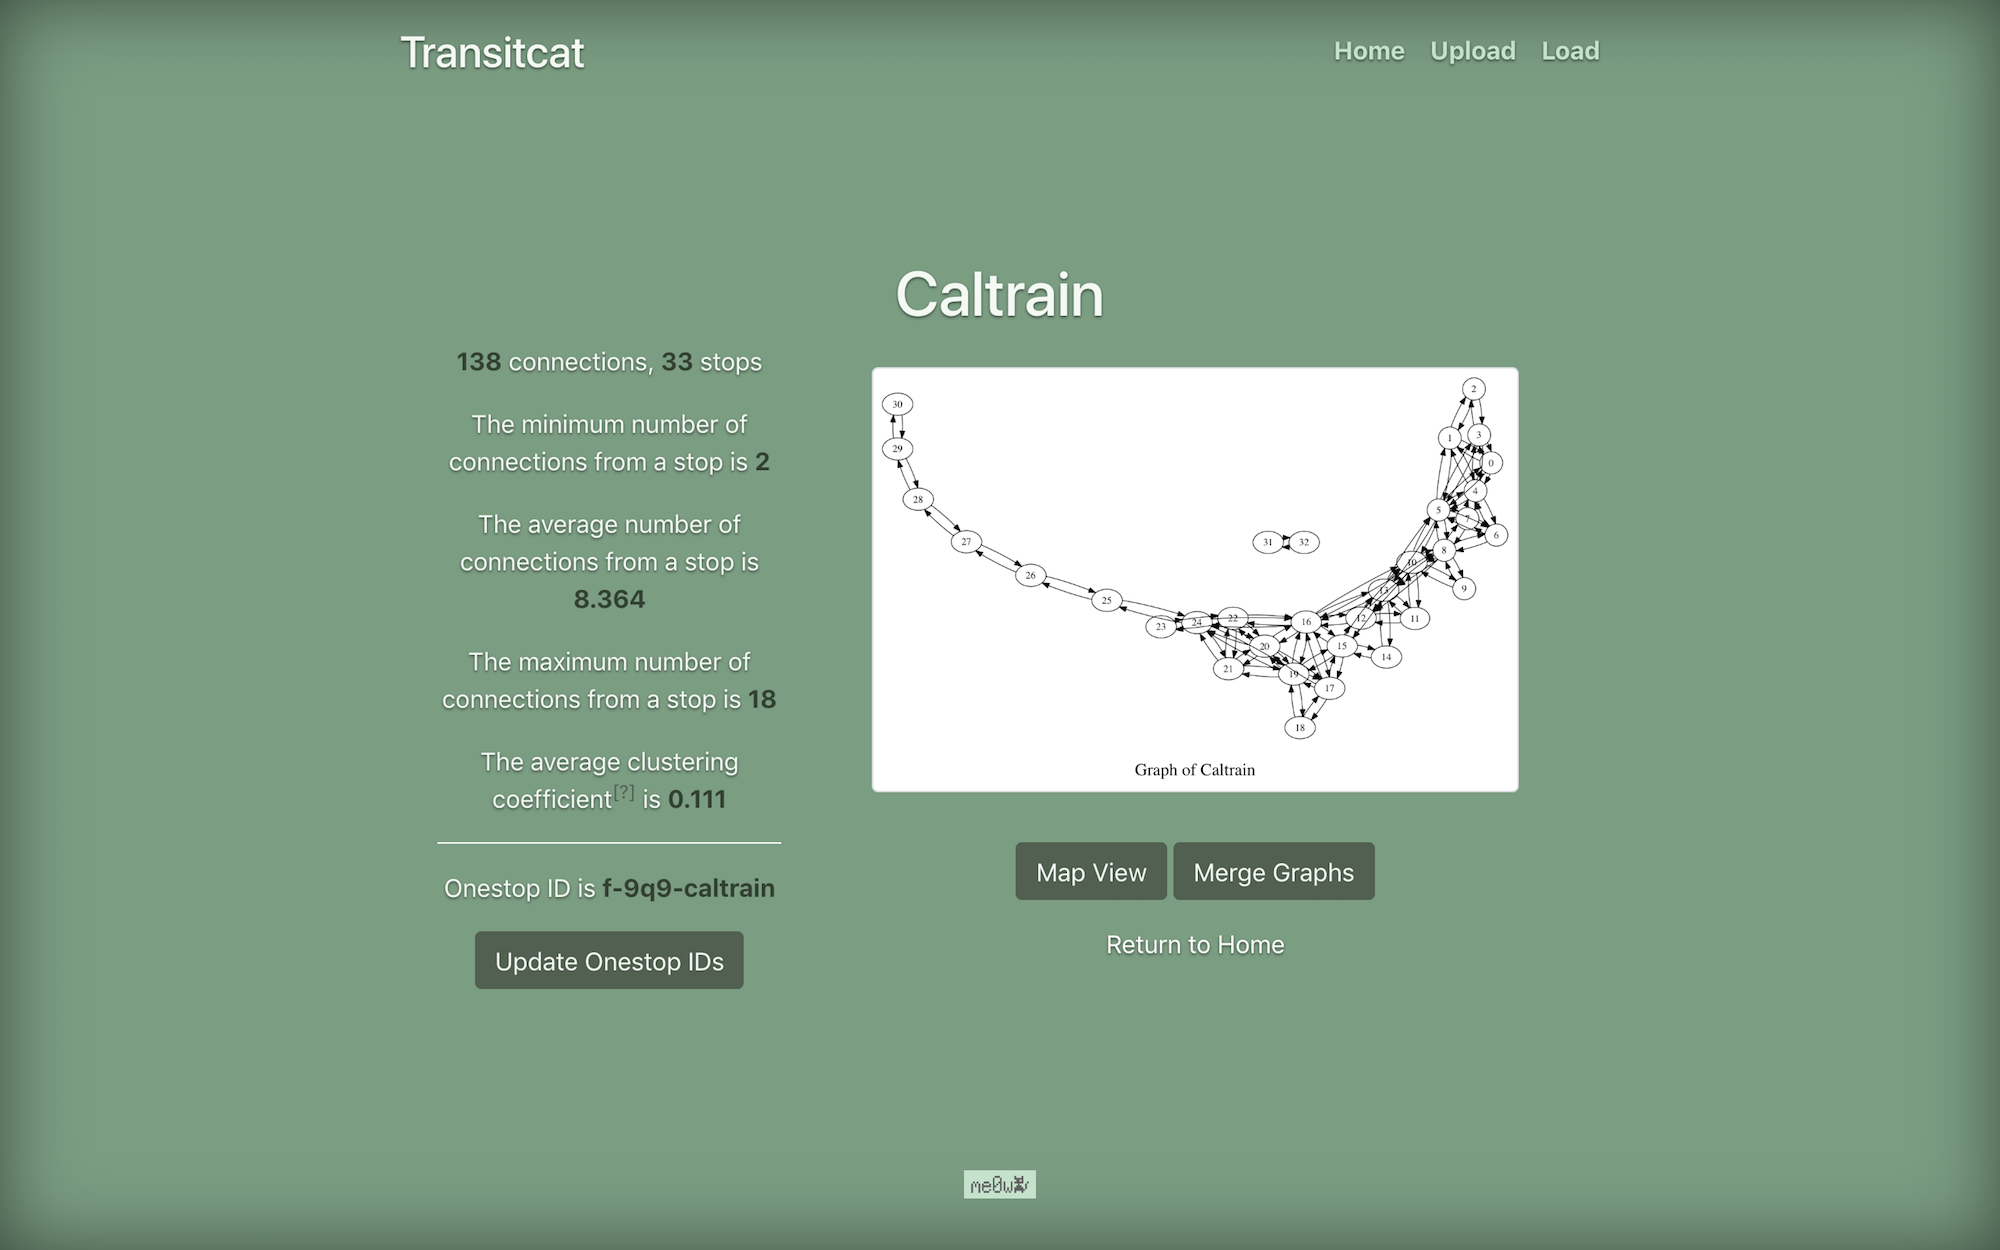
A Transitcat user begins by uploading a GTFS zip file for a particular public transit network (PTN), such as Caltrain or the New York subway. We then feed this data into SNAP to build a directed graph that models the PTN; each stop is represented as a node, and two nodes share an edge if they represent consecutive stops on the same transit line. At this point we provide the user with some helpful graph stats (e.g., the number of nodes/edges and the average node degree) as well as allow them to merge their network with other PTNs. This merging feature is particularly useful as it allows users to build aggregate PTNs from multiple transit types, which in turn empowers them to conduct more thorough and real-world analyses, such as examining how Caltrain, BART, and Muni work together for riders in the Bay Area.
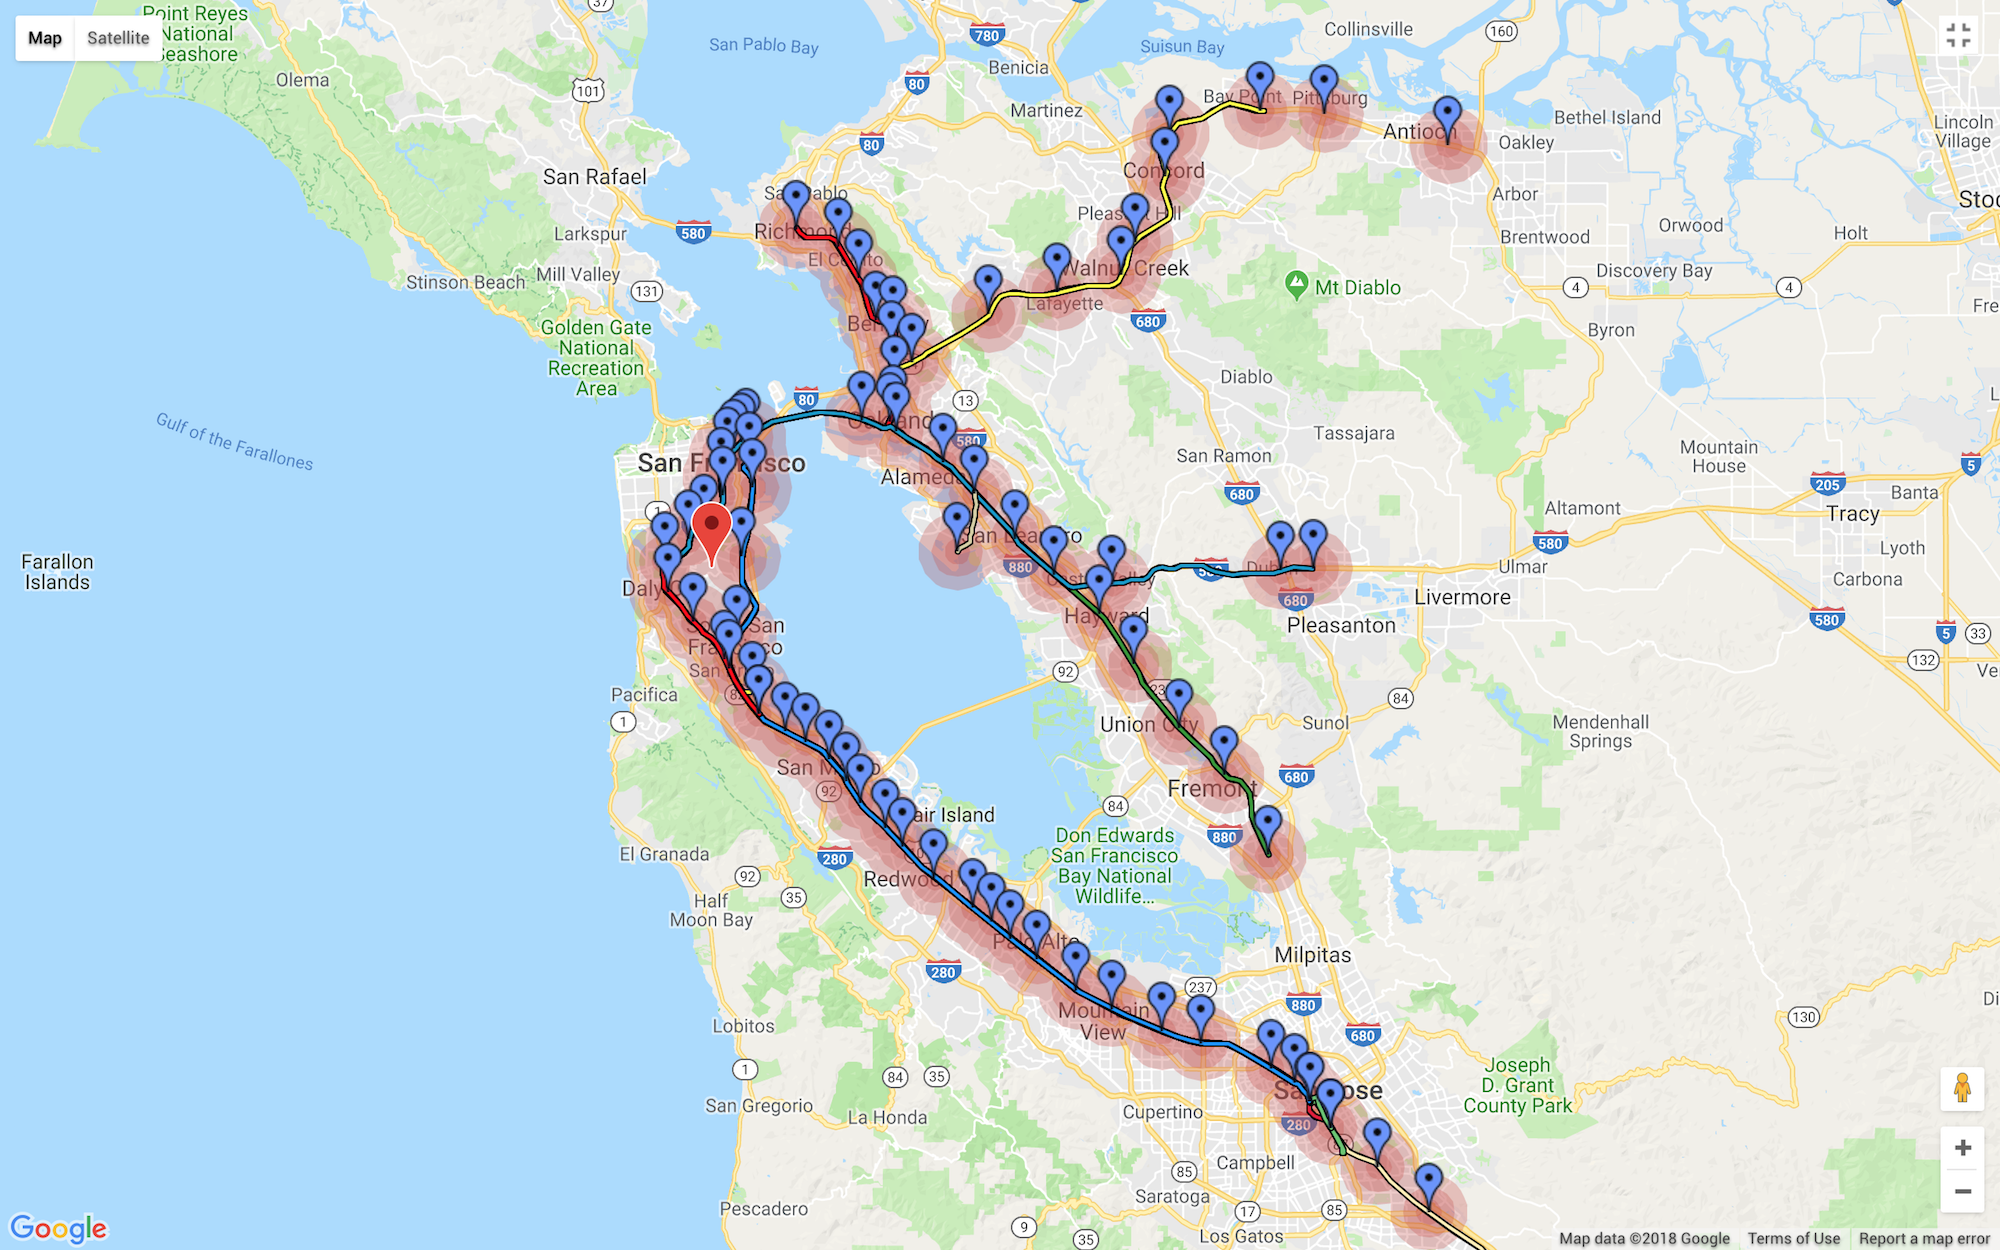
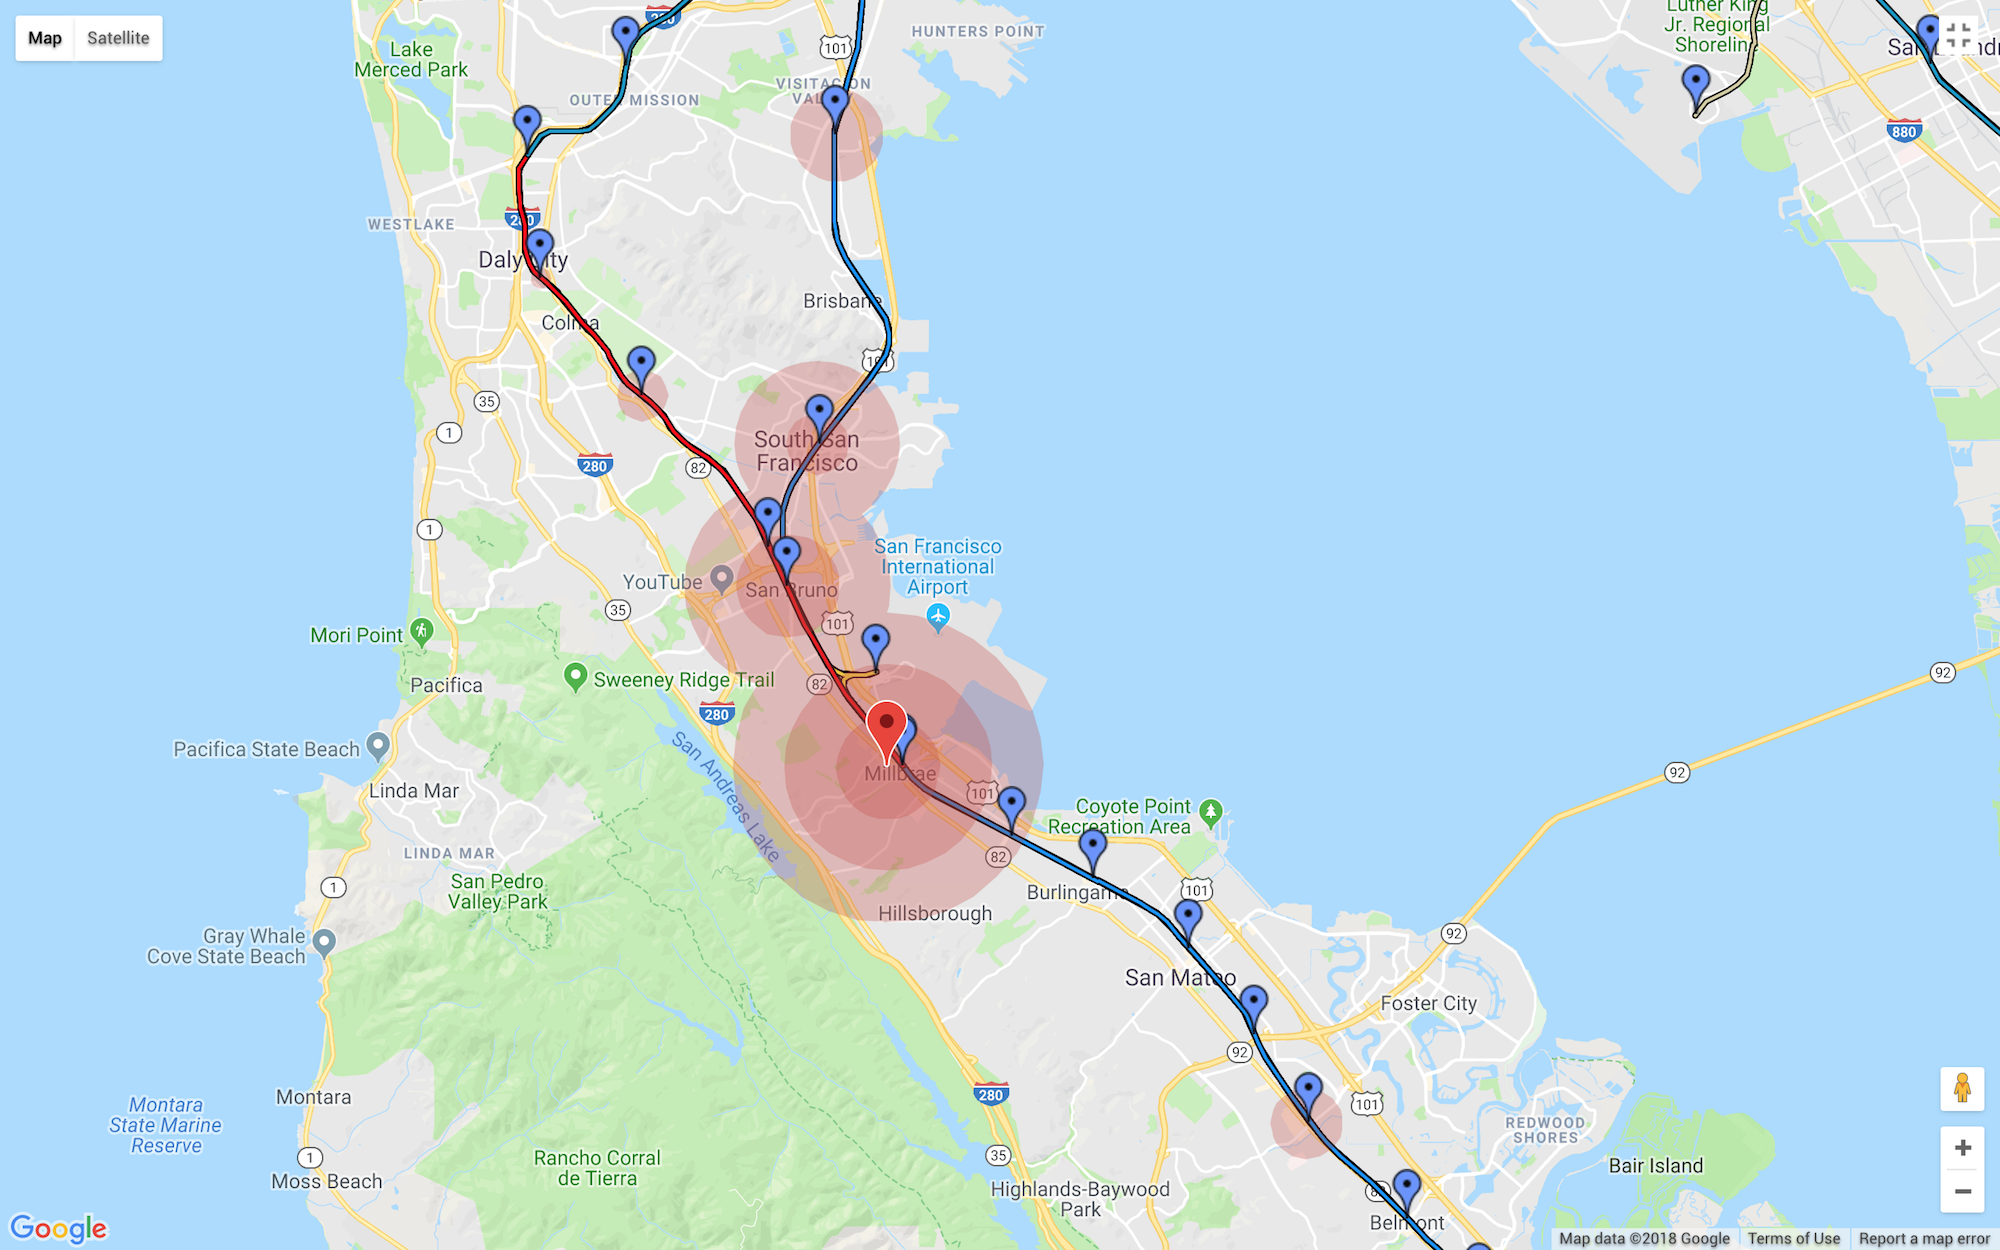
One of the limits of our directed graph model, however, is that it does not convey any geographic or spatial meaning. To remedy this issue, Transitcat also provides a nice visualization of a PTN’s stops and lines using the Google Maps API. From here users can take advantage of one of our application’s most powerful features: the ability to generate isochrone maps. Basically, we let users drop a pin anywhere on the map to indicate a starting point. We then utilize the previously mentioned Transitland API as well as some clever algorithm magic to figure out how far a rider can travel from that point within 10, 20, and 30 minutes using any combination of walking and public transit. The reachable areas for these three different time windows are represented by the red circles of increasing radius shown on the map. Users can also tweak both the day of the week and time of the day (e.g., Wednesday at 5pm) to see how the isochrones change over time.
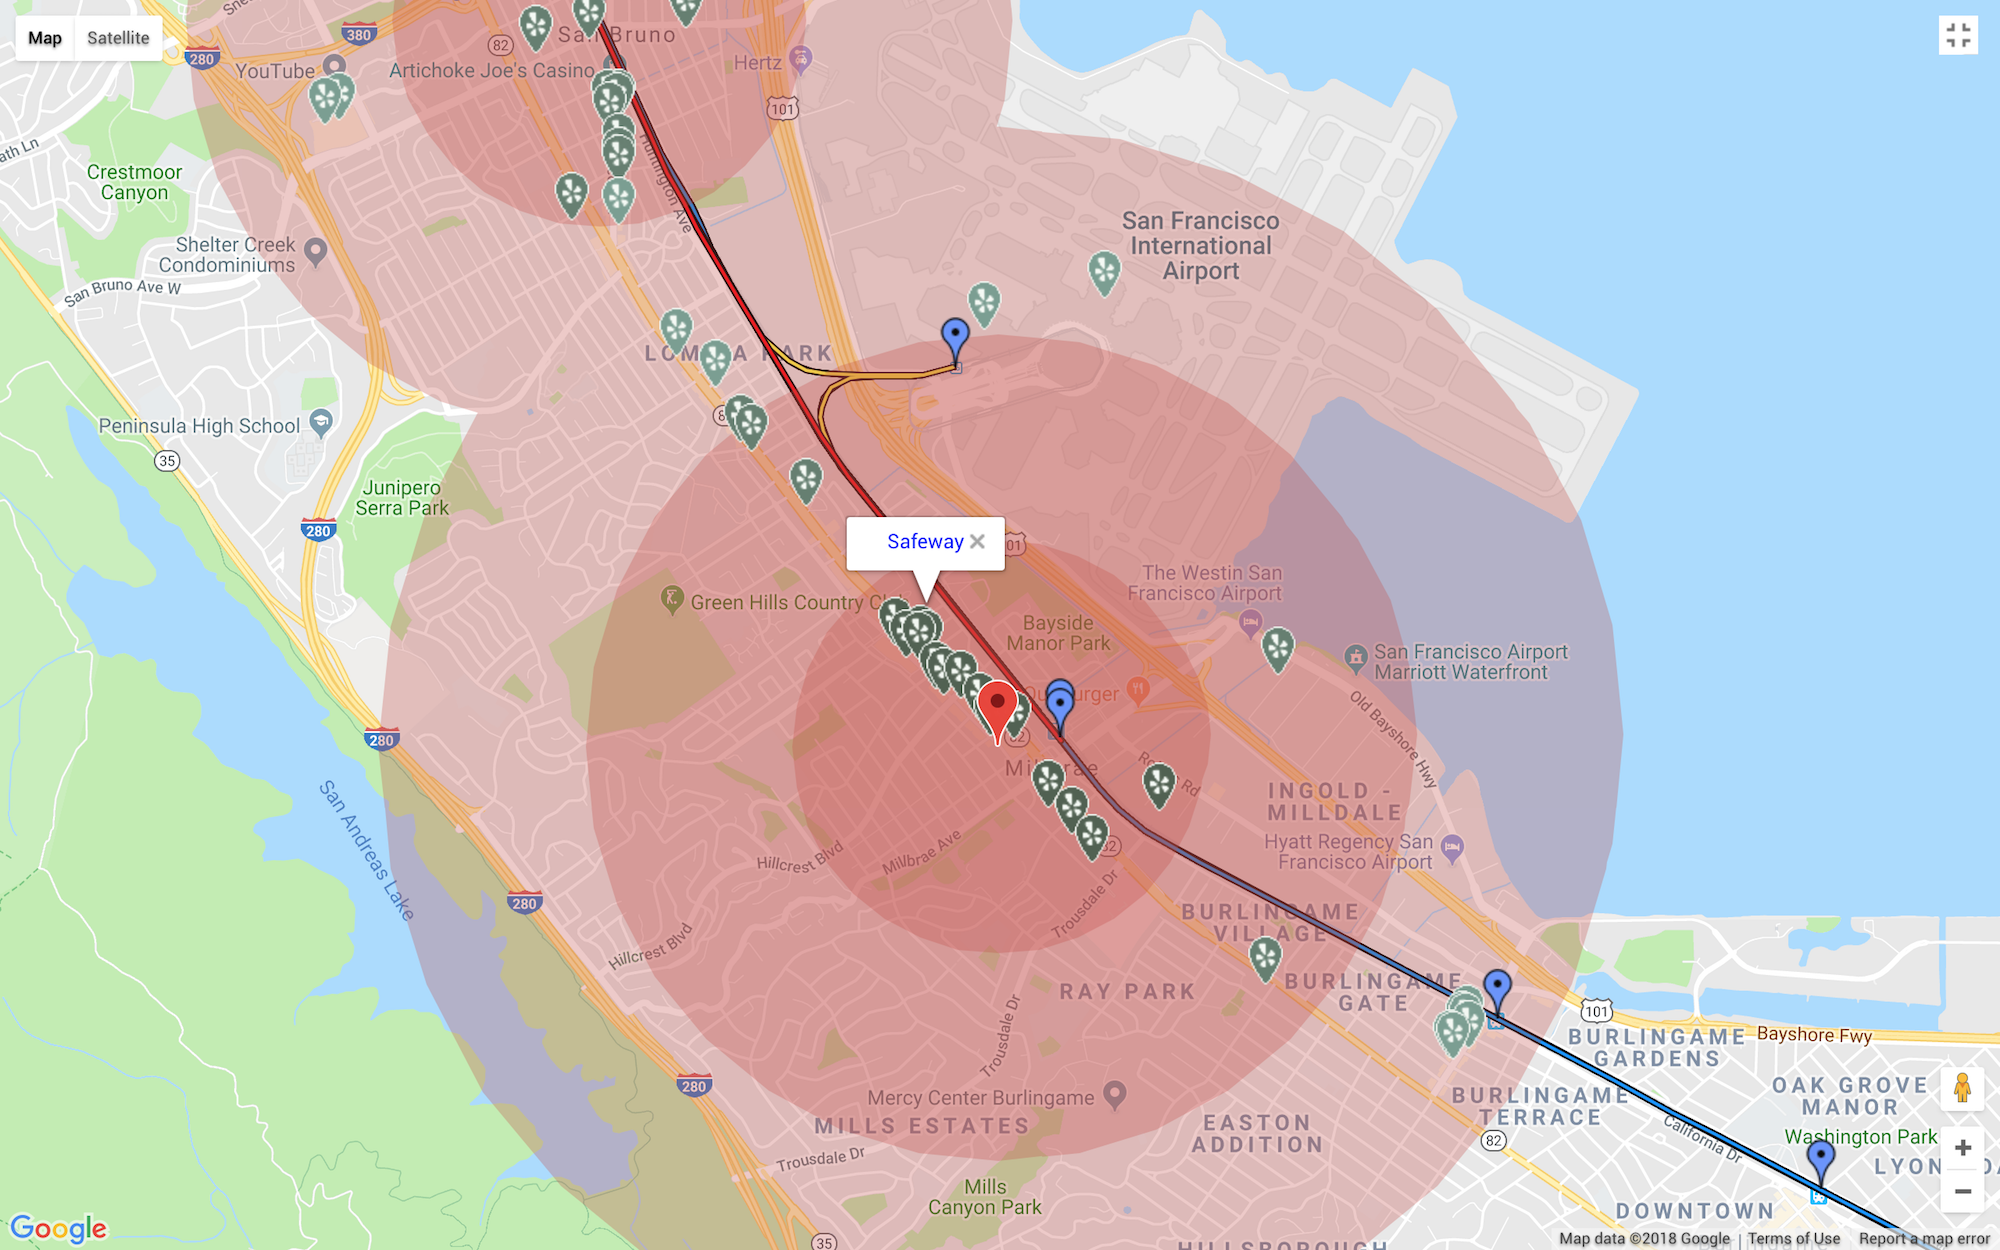
As an added bonus, users can search within these isochrones for nearby businesses, which provides a quick metric for evaluating the equity of a PTN. For instance, a public transit planner might be interested in knowing how many grocery stores or banks are within walking distance of a particular stop. Or they simply might want to know how many Thai restaurants are in the area 😋. Either way, Transitcat seamlessly correlates public transit data with business information (available via the Yelp API), which is a feature that several of our needfinding contacts suggested.
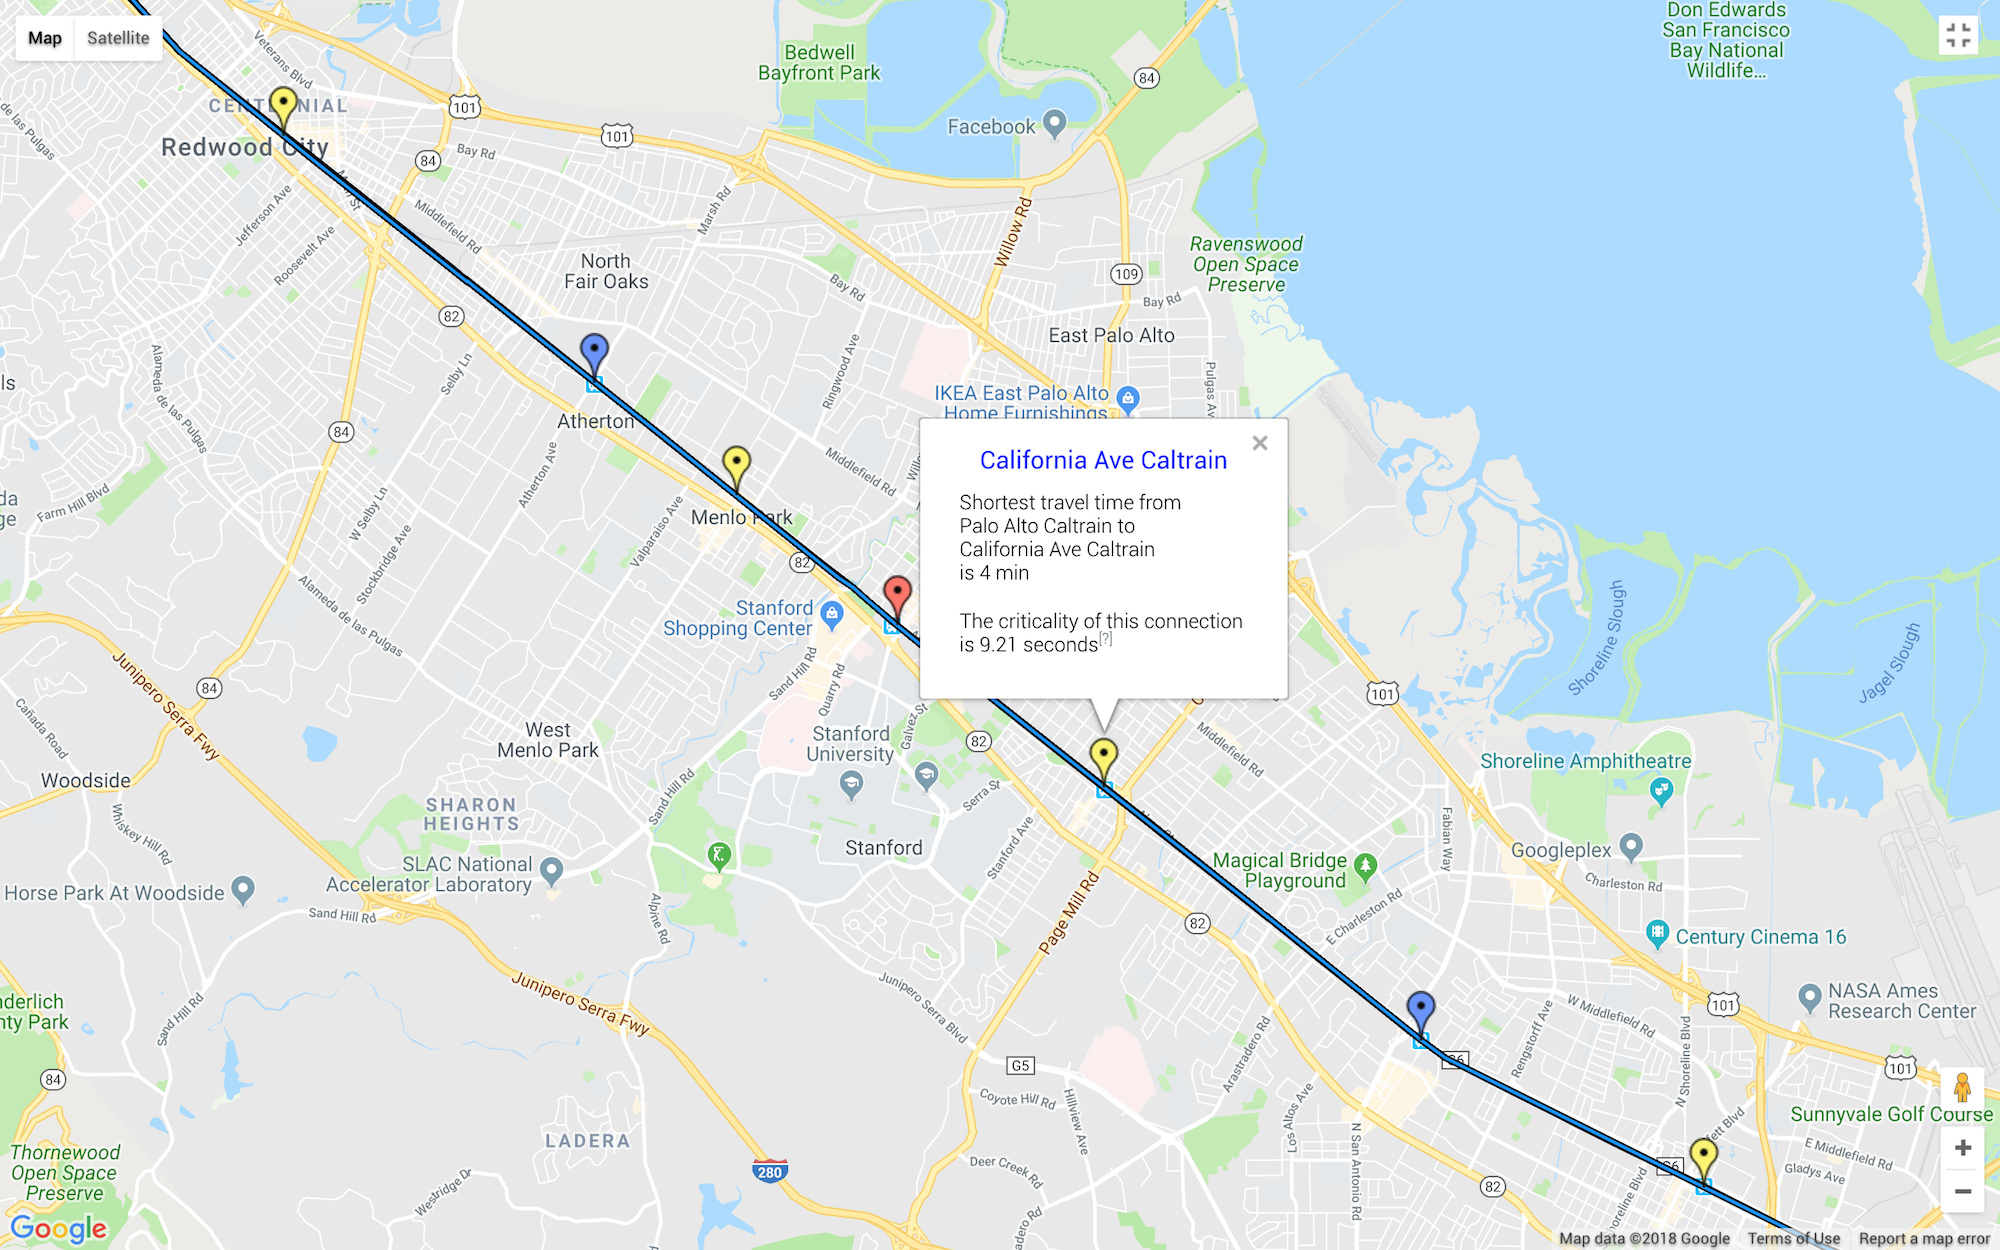
A final feature of Transitcat that’s worth highlighting is its ability to perform vulnerability analysis. Every day PTNs play a critical role in the lives of millions of people, and consequently it is becoming more important to understand the effects of potential disruptions to these networks, whether from infrastructure failure, severe weather, or targeted attacks.
To aid with this sort of analysis Transitcat allows users to select a connection between two stops in a PTN. Our app then determines how much the average travel time across the network would increase if that particular connection was removed, which is called the criticality of that edge. Although there are some limitations to this calculation (e.g., Transitcat makes the unrealistic assumption that all lines are running at all times of the day), criticality does provide a convenient baseline for measuring the relative importance of different connections in a PTN, which can be a nice starting point for helping public transit planners determine where to modify service frequency or implement new stops.
Overall my teammates and I were extremely pleased with how Transitcat turned out. Besides learning new technologies and gaining experience working on a self-initiated team software project, we were also able to create something that has practical applications beyond the classroom and that we believe can make a real difference for public transit planners. Although we currently don’t have the time to continue active development of Transitcat, we have made all of the source code publicly available on Github. We’ve included instructions for getting the application up and running locally on your machine; we encourage you to play around with it, extend it or even use it as a jumping-off point for future GTFS-related applications!